All-Time Champions Trophy Records: Highest Run-Scorers, Team Totals, and More
ICC Champions Trophy (1998-2017) – a statistical survey
This 50-over tournament started in the late 1990s when one-day cricket was probably at its peak popularity. The ICC Champions Trophy, as we know it today, was called the ICC Knockout. The first edition was lapped up by both television viewers and the host nation Bangladesh purely for the exciting high-octave cricket it generated.
The brainchild of former BCCI President and then ICC Chairman Jagmohan Dalmiya, the tournament was formed to generate some fund for the ICC coffers and bring high-quality cricket to non-Test-playing countries that would, at the time, have no other way of watching live action of any kind. Therefore, the first two editions were hosted by Bangladesh in 1998 (which became a Test nation only in 2000) and Kenya in 2000.
The tournament went through changes in format and names. From the ICC Knockout, it became the Mini World Cup and has been now called the ICC Champions Trophy since 2002. The tournament was played every two years regularly till 2006. The sixth edition, which was to be held in Pakistan in 2008, had to be cancelled due to security reasons, but was finally held in South Africa in 2009. The seventh edition in 2013 was supposed to be the final tournament of this series and was to be succeeded by the ICC World Test Championship, which was proposed to start from 2017 onwards. However, since the latter did not take off for various reasons, the ICC decided to continue with the eighth edition of the tournament in 2017, especially when England came forward to host the series for the third time and the second successive time.
Apart from the sixth edition, as seen below, every tournament has a different winner. Australia, the current World Cup champion, is the only side to win the trophy outright twice, in 2006 and 2009. In 2000, New Zealand won its first-ever international cricket tournament, while the West Indies, in 2004, won its first-ever major cricket title since the 1979 World Cup. Both India and Sri Lanka shared the trophy in 2002. But India, in 2013, won it outright and was favourite four years later. However, in 2017, there was a new champion in Pakistan when it defeated India by a margin of 180 runs, which was by far the biggest-ever win in a final.
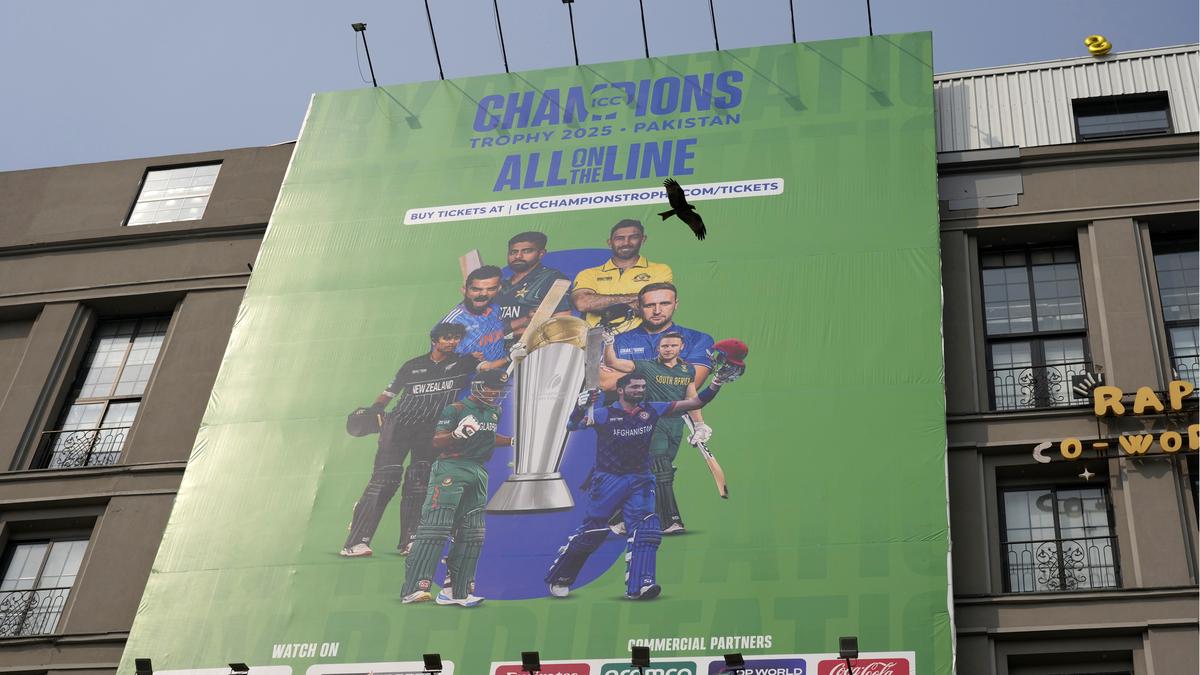
The previous eight editions of the ICC Champions Trophy saw 115 matches from 1998 to 2017, during which several records were set, as given in the tables below. The ninth edition returns to the international scene after eight long years, starting on February 19. For the next three weeks, 15 matches will be played simultaneously in Pakistan and the UAE. The final is slated for March 9, 2025.
Winner/runner-up:
|
# |
Month, Year |
Final venue |
Host country |
Winner |
Runner-up |
Semi-finalists |
Total Matches |
Total teams |
|
1 |
Oct-Nov 1998 |
Dhaka |
Bangladesh |
South Africa |
West Indies |
Sri Lanka, India |
8 |
9 |
|
2 |
Oct 2000 |
Nairobi Gym |
Kenya |
New Zealand |
India |
Pakistan, South Africa |
10 |
11 |
|
3 |
Sept 2002 |
Colombo, RP |
Sri Lanka |
India/Sri Lanka+ |
— |
South Africa, Australia |
16# |
12 |
|
4 |
Sept 2004 |
The Oval |
England |
West Indies |
England |
Australia, Pakistan |
15 |
12 |
|
5 |
Oct-Nov 2006 |
Mumbai, BS |
India |
Australia |
West Indies |
New Zealand, South Africa |
21 |
10 |
|
6 |
Sept-Oct 2009 |
Centurion |
South Africa |
Australia |
New Zealand |
England, Pakistan |
15 |
8 |
|
7 |
June 2013 |
Birmingham |
England |
India |
England |
South Africa, Sri Lanka |
15 |
8 |
|
8 |
June 2017 |
The Oval |
England |
Pakistan |
India |
England, Bangladesh |
15 |
8 |
+ joint winners # matches include a replayed final
In 1998 and 2000 it was played as ICC Knockout
Notes:** Australia is the only team to win it twice outright. India also won twice — once shared and once outright.
** In all 13 international sides have participated in this tournament, including three (Kenya, Netherlands & USA) non-Test playing nations.
Highest team totals:
|
Total |
Overs |
For |
Opp |
Venue |
Date |
Result |
|
347-4 |
50 |
NZ |
USA |
The Oval |
10-09-2004 |
Won |
|
338-4 |
50 |
Pak |
Ind |
The Oval |
18-06-2017 |
Won |
|
331-7 |
50 |
Ind |
SA |
Cardiff |
6-06-2013 |
Won |
|
323-8 |
50 |
Eng |
SA |
Centurion |
27-09-2009 |
Won |
|
322-3 |
48.4 |
SL |
Ind |
The Oval |
8-06-2017 |
Won |
|
321-6 |
50 |
Ind |
SL |
The Oval |
8-06-2017 |
Lost |
|
319-3 |
50 |
Ind |
Pak |
Birmingham |
4-06-2017 |
Won |
|
319-8 |
50 |
SL |
SA |
Centurion |
22-09-2009 |
Won |
|
316-5 |
50 |
SA |
Ken |
Colombo, RP |
20-09-2002 |
Won |
|
315-7 |
50 |
NZ |
SL |
Johannesburg |
27-09-2009 |
Won |
Notes:
Sri Lanka’s 322/3 against India at the Oval in 2017 is the highest successful run chase
Lowest team totals:
|
Total |
Overs |
For |
Opp |
Venue |
Date |
Result |
|
65-10 |
24.0 |
USA |
Aus |
Southampton |
13-09-2004 |
Lost |
|
77-10 |
19.3 |
Ban |
NZ |
Colombo, SSC |
23-09-2002 |
Lost |
|
80-10 |
30.4 |
WI |
SL |
Mumbai, BS |
14-01-2006 |
Lost |
|
85-10 |
30.1 |
Zim |
WI |
Ahmedabad |
08-10-2006 |
Lost |
|
86-10 |
29.3 |
Neth |
SL |
Colombo, RP |
16-09-2002 |
Lost |
|
89-10 |
25.0 |
Pak |
SA |
Mohali |
27-10-2006 |
Lost |
Note: 169/10 (23.3 ov) by England vs New Zealand (159/8) in Cardiff, 16-6-2013, the lowest winning total and is also the lowest total successfully defended in the tournament
Total individual 100s: 50 by 38 batters
|
Country |
100s |
Highest |
Batter |
Opp |
Venue |
Date |
Result |
|
India |
10 |
141* |
Sourav Ganguly |
SA |
Nairobi |
13-10-2000 |
Won |
|
Sri Lanka |
7 |
134* |
Kumar Sangakkara |
Eng |
The Oval |
13-06-2013 |
Won |
|
West Indies |
6 |
133* |
Chris Gayle |
SA |
Jaipur |
02-11-2006 |
Won |
|
South Africa |
6 |
141 |
Graeme Smith |
Eng |
Centurion |
27-09-2009 |
Lost |
|
Australia |
3 |
136* |
Shane Watson |
Eng |
Centurion |
02-10-2009 |
Won |
|
England |
5 |
133* |
Joe Root |
Ban |
The Oval |
10-06-2017 |
Won |
|
Pakistan |
4 |
128 |
Shoaib Malik |
Ind |
Centurion |
26-09-2009 |
Won |
|
New Zealand |
3 |
145* |
Nathan Astle |
USA |
The Oval |
10-09-2014 |
Won |
|
Zimbabwe |
2 |
145 |
Andy Flower |
Ind |
Colombo RP |
14-09-2002 |
Lost |
|
Bangladesh |
4 |
128 |
Tamim Iqbal |
Eng |
The Oval |
01-06-2017 |
Lost |
Highest individual scores
|
Runs |
Batter |
For |
Opp |
Venue |
Date |
Result |
|
145* |
Nathan Astle |
NZ |
USA |
The Oval |
10-09-2004 |
Won |
|
145 |
Andy Flower |
Zim |
Ind |
Colombo, RP |
14-09-2002 |
Lost |
|
141* |
Sourav Ganguly |
Ind |
SA |
Nairobi |
13-10-2000 |
Won |
|
141 |
Sachin Tendulkar |
Ind |
Aus |
Dhaka |
28-10-1998 |
Won |
|
141 |
Greame Smith |
SA |
Eng |
Centurion |
27-09-2010 |
Lost |
|
136* |
Shane Watson |
Aus |
Eng |
Centurion |
2-10-2009 |
Won |
|
134* |
Kumar Sangakkara |
SL |
Eng |
The Oval |
13-06-2013 |
Won |
|
133* |
Chris Gayle |
WI |
SA |
Jaipur |
2-11-2006 |
Won |
|
133* |
Joe Root |
Eng |
Ban |
The Oval |
1-06-2017 |
Won |
|
132 |
Avishka Gunawardene |
SL |
WI |
Nairobi |
4-10-2000 |
Won |
Quickest individual innings
(min 40+ runs)
|
Runs |
Balls |
S/R |
Batter |
For |
Opp |
Venue |
Date |
Result |
|
55* |
18 |
305.55 |
Shahid Afridi |
Pak |
Net |
Colombo, SSC |
21-09-2002 |
Won |
|
64* |
27 |
237.03 |
Craig McMillan |
NZ |
USA |
The Oval |
10-09-2004 |
Won |
|
67 |
34 |
197.05 |
Eoin Morgan |
Eng |
SA |
Centurion |
27-09-2009 |
Won |
|
76 |
43 |
176.74 |
Hardik Pandya |
Ind |
Pak |
The Oval |
18-06-2017 |
Lost |
|
49* |
29 |
168.96 |
Mohd Kaif |
Ind |
Ken |
Southampton |
11-09-2004 |
Won |
|
53 |
32 |
165.63 |
Yuvraj Singh |
Ind |
Pak |
Birmingham |
04-06-2017 |
Won |
|
47* |
29 |
162.07 |
Ravindra Jadeja |
Ind |
SA |
Cardiff |
6-06-2013 |
Won |
|
56* |
35 |
160.00 |
Darren Sammy |
WI |
Ind |
The Oval |
11-06-2013 |
Lost |
|
73* |
47 |
155.31 |
Mitchell Johnson |
Aus |
WI |
Johannesburg |
26-09-2009 |
Won |
|
57* |
37 |
154.05 |
Mohd Hafeez |
Pak |
Ind |
The Oval |
18-06-2017 |
Won |
|
58* |
38 |
152.63 |
Nuwan Kulasekara |
SL |
Eng |
The Oval |
13-06-2013 |
Won |
|
65 |
43 |
151.16 |
Luke Ronchi |
NZ |
Aus |
Birmingham |
02-06-2017 |
NR |
|
71* |
47 |
151.06 |
Andy Symonds |
Aus |
NZ |
The Oval |
16-09-2004 |
Won |
Quickest to reach 50 in fewest balls
|
Balls |
Batter |
Runs |
For |
Agst |
Venue |
Date |
Result |
|
18 |
Shahid Afridi |
55* |
Pak |
Neth |
Colombo, SSC |
21-09-2002 |
Won |
|
21 |
Craig McMillan |
64* |
NZ |
USA |
The Oval |
10-09-2004 |
Won |
|
26 |
Eoin Morgan |
67 |
Eng |
SA |
Centurion |
27-09-2009 |
Won |
|
28 |
Jesse Ryder |
74 |
NZ |
SL |
Johannesburg |
27-09-2009 |
Won |
|
29 |
Yuvraj Singh |
53 |
Ind |
Pak |
Birmingham |
04-06-2017 |
Won |
|
30 |
Nuwan Kulasekara |
58* |
SL |
Eng |
The Oval |
13-06-2013 |
Won |
Quickest to reach 100 in fewest balls
|
Balls |
Batter |
Runs |
For |
Opp |
Venue |
Date |
Result |
|
77 |
Virender Sehwag |
126 |
Ind |
Eng |
Colombo, RP |
21-09-2002 |
Won |
|
80 |
Shikhar Dhawan |
114 |
Ind |
SA |
Cardiff |
6-06-2013 |
Won |
|
87 |
Tillkeratne Dilshan |
106 |
SL |
SA |
Centurion |
22-09-2009 |
Won |
|
89 |
Marcus Trescothick |
119 |
Eng |
Zim |
Colombo, RP |
18-09-2002 |
Won |
|
89 |
Andy Flintoff |
104 |
Eng |
SL |
Southampton |
18-9-2004 |
Won |
|
92 |
Fakhar Zaman |
114 |
Pak |
Ind |
The Oval |
18-06-2017 |
Won |
|
91 |
Jacques Kallis |
113* |
SA |
SL |
Dhaka |
30-10-1998 |
Won |
|
95 |
Sachin Tendulkar |
141 |
Ind |
Aus |
Dhaka |
28-10-1998 |
Won |
|
96 |
Kane Williamson |
100 |
NZ |
Aus |
Birmingham |
02-06-2017 |
NR |
Highest batting strike-rates: (min 10 inngs/100 runs)
|
S/R |
Batter |
For |
M |
Inns |
NO |
Runs |
Ave. |
HS |
100/50 |
|
124.63 |
Shahid Afridi |
Pak |
13 |
13 |
2 |
167 |
15.18 |
55* |
0/1 |
|
101.59 |
Shikhar Dhawan |
Ind |
10 |
10 |
1 |
701 |
77.89 |
125 |
3/3 |
|
100.78 |
Virender Sehwag |
Ind |
10 |
10 |
2 |
389 |
48.63 |
126 |
1/2 |
|
94.09 |
Adam Gilchrist |
Aus |
13 |
13 |
1 |
382 |
31.83 |
92 |
0/2 |
|
92.32 |
Virat Kohli |
Ind |
13 |
12 |
6 |
529 |
88.17 |
96* |
0/5 |
|
92.03 |
Eoin Morgan |
Eng |
13 |
13 |
3 |
439 |
43.90 |
87 |
0/4 |
|
88.78 |
Chris Gayle |
WI |
17 |
17 |
2 |
791 |
52.73 |
133* |
3/1 |
|
88.11 |
Mohd Hafeez |
Pak |
11 |
11 |
2 |
252 |
28.00 |
57* |
0/1 |
|
88.01 |
Sanath Jayasuriya |
SL |
20 |
20 |
2 |
536 |
29.78 |
102* |
1/1 |
Lowest batting strike-rates: (min 10 inngs/100 runs)
|
S/R |
Batter |
For |
M |
Inns |
NO |
Runs |
Ave. |
HS |
100/50 |
|
65.52 |
Kamran Akmal |
Pak |
10 |
10 |
0 |
152 |
15.20 |
44 |
0/0 |
|
65.72 |
Marva Atapattu |
SL |
17 |
16 |
2 |
393 |
28.07 |
101 |
1/1 |
|
67.39 |
Ross Taylor |
NZ |
11 |
11 |
1 |
281 |
28.10 |
72 |
0/2 |
|
67.45 |
Brendon McCullum |
NZ |
14 |
12 |
0 |
286 |
23.83 |
48 |
0/0 |
|
67.79 |
Mohd Yousuf |
Pak |
13 |
12 |
2 |
484 |
48.40 |
87 |
0/3 |
|
67.94 |
Shiv Chanderpaul |
WI |
16 |
16 |
5 |
587 |
53.36 |
74 |
0/5 |
Highest batting averages: (min 10 inngs/100 runs)
|
Ave. |
Batter |
For |
M |
Inns |
NO |
Runs |
HS |
100/50 |
S/R |
|
88.17 |
Virat Kohli |
Ind |
13 |
12 |
6 |
529 |
96* |
0/5 |
92.32 |
|
77.89 |
Shikhar Dhawan |
Ind |
10 |
10 |
1 |
701 |
125 |
3/3 |
101.59 |
|
73.89 |
Sourav Ganguly |
Ind |
13 |
11 |
2 |
665 |
141* |
3/3 |
83.13 |
|
61.50 |
Damien Martyn |
Aus |
12 |
11 |
3 |
492 |
78 |
0/5 |
73.98 |
|
53.44 |
Rohit Sharma |
Ind |
10 |
10 |
1 |
481 |
123* |
1/4 |
82.50 |
|
53.36 |
Shiv Chanderpaul |
WI |
16 |
16 |
5 |
587 |
74 |
0/5 |
67.94 |
|
52.73 |
Chris Gayle |
WI |
17 |
17 |
2 |
791 |
133* |
3/1 |
88.78 |
|
51.11 |
Herschelle Gibbs |
SA |
10 |
10 |
1 |
460 |
116* |
3/1 |
85.50 |
|
50.38 |
Paul Collingwood |
Eng |
11 |
11 |
3 |
403 |
82 |
0/2 |
78.71 |
Leading run-getters
|
Runs |
Batter |
For |
M |
Inn |
NO |
Ave. |
HS |
100/50 |
S/r |
|
|
|
791 |
Chris Gayle |
WI |
17 |
17 |
2 |
52.73 |
133* |
3/1 |
88.78 |
|
|
|
742 |
Mahela Jayawardene |
SL |
22 |
21 |
3 |
41.22 |
84* |
0/5 |
84.80 |
|
|
|
701 |
Shikhar Dhawan |
Ind |
10 |
10 |
1 |
77.89 |
125 |
3/3 |
101.59 |
|
|
|
683 |
Kumar Sangakkara |
SL |
22 |
21 |
3 |
37.94 |
134* |
1/4 |
71.37 |
|
|
|
665 |
Sourav Ganguly |
Ind |
13 |
11 |
2 |
73.89 |
141* |
3/3 |
83.13 |
|
|
|
653 |
Jacques Kallis |
SA |
17 |
17 |
3 |
46.64 |
113* |
1/3 |
77.46 |
|
|
|
627 |
Rahul Dravid |
Ind |
19 |
15 |
2 |
48.23 |
76 |
0/6 |
73.33 |
|
|
|
593 |
Ricky Ponting |
Aus |
18 |
18 |
3 |
39.53 |
111* |
1/4 |
76.52 |
|
|
|
587 |
Shivnarine Chanderpaul |
WI |
16 |
16 |
5 |
53.36 |
74 |
0/5 |
67.94 |
|
|
|
536 |
Sanath Jayasuriya |
SL |
20 |
20 |
2 |
29.78 |
102* |
1/1 |
88.01 |
|
|
|
529 |
Virat Kohli |
Ind |
13 |
12 |
6 |
88.17 |
96* |
0/5 |
92.32 |
|
|
Most individual 100s: 3 each from Sourav Ganguly, Chris Gayle, Herschelle Gibbs & Shikhar Dhawan
Best bowling
|
Figures |
Bowler |
For |
Opp |
Venue |
Date |
Result |
|
6/14 |
Ferveez Maharoof |
SL |
WI |
Mumbai, BS |
14-10-2006 |
Won |
|
6/52 |
Josh Hazlewood |
Aus |
NZ |
Birmingham |
02-06-2017 |
NR |
|
5/11 |
Shahid Afridi |
Pak |
Ken |
Birmimgham |
15-09-2004 |
Won |
|
5/21 |
Makaya Ntini |
SA |
Pak |
Mohali |
27-10-2006 |
Won |
|
5/29 |
Merv Dillon |
WI |
Ban |
Southampton |
15-09-2004 |
Won |
|
5/30 |
Jacques Kallis |
SA |
WI |
Dhaka |
01-11-1998 |
Won |
|
5/36 |
Jacob Oram |
NZ |
USA |
The Oval |
10-09-2004 |
Won |
|
5/36 |
Ravindra Jadeja |
Ind |
WI |
The Oval |
11-06-2013 |
Won |
|
5/37 |
Glenn McGrath |
Aus |
NZ |
Colombo SSC |
15-09-2002 |
Won |
|
5/46 |
Shayne O’Connor |
NZ |
Pak |
Nairobi Gym |
11-10-2000 |
Won |
|
5/57 |
Wayne Parnell |
SA |
NZ |
Centurion |
24-09-2009 |
Won |
Notes:
* On 11 occasions five-wicket hauls have been claimed by bowlers. No bowler has done it twice
* West Indian Gavis Tonge’s 4/25 vs Pakistan in Johannesburg on 23-9-2009 is the best bowling figures in a losing cause.
Best bowling economy rates: (min 300 balls)
|
R/O |
Bowler |
For |
M |
Balls |
Runs |
Wkts |
Ave. |
S/R |
Best |
|
3.61 |
M. Muralitharan |
SL |
17 |
805 |
484 |
24 |
20.17 |
33.54 |
4/15 |
|
3.64 |
Shaun Pollock |
SA |
11 |
529 |
322 |
16 |
20.13 |
33.06 |
3/27 |
|
3.66 |
Dan Vettori |
NZ |
17 |
856 |
522 |
18 |
29.00 |
47.56 |
3/14 |
|
3.73 |
Jason Gillespie |
Aus |
7 |
336 |
209 |
12 |
17.42 |
28.00 |
4/15 |
|
3.75 |
Ian Bradshaw |
WI |
10 |
534 |
334 |
14 |
23.86 |
38.14 |
3/30 |
|
3.78 |
Sanath Jayasuriya |
SL |
20 |
600 |
378 |
14 |
27.00 |
42.86 |
3/39 |
|
3.93 |
Chaminda Vaas |
SL |
16 |
754 |
494 |
18 |
27.44 |
41.89 |
2/6 |
|
3.97 |
Harbhajan Singh |
Ind |
13 |
750 |
496 |
14 |
35.43 |
53.57 |
3/27 |
Worst bowling economy rates: (min 300 balls)
|
R/O |
Bowler |
For |
M |
Balls |
Runs |
Wkts |
Ave. |
S/R |
Best |
|
5.79 |
Ishant Sharma |
Ind |
7 |
321 |
310 |
13 |
23.85 |
24.69 |
3/33 |
|
5.59 |
Stuart Broad |
Eng |
8 |
384 |
358 |
16 |
22.38 |
24.00 |
4/49 |
|
5.57 |
Umesh Yadav |
Ind |
7 |
318 |
295 |
7 |
42.14 |
45.43 |
3/30 |
|
5.32 |
Lasith Malinga |
SL |
16 |
864 |
766 |
25 |
30.64 |
34.56 |
4/34 |
|
5.30 |
Ajit Agarkar |
Ind |
12 |
548 |
484 |
11 |
44.00 |
49.82 |
2/40 |
|
5.19 |
Shaun Bond |
NZ |
10 |
546 |
472 |
17 |
27.76 |
32.12 |
4/21 |
Best bowling strike-rates: (min 300 balls)
|
S/R |
Bowler |
For |
M |
Balls |
Runs |
Wkts |
Ave. |
R/O |
Best |
|
20.63 |
Ferveez Maharoof |
SL |
8 |
330 |
247 |
16 |
15.44 |
4.49 |
6/14 |
|
21.38 |
Makaya Ntini |
SA |
8 |
342 |
248 |
16 |
15.50 |
4.35 |
5/21 |
|
21.47 |
Merv Dillon |
WI |
7 |
408 |
317 |
19 |
16.68 |
4.66 |
5/29 |
|
24.00 |
Stuart Broad |
Eng |
8 |
384 |
358 |
16 |
22.38 |
5.59 |
4/49 |
|
24.11 |
Kyle Mills |
NZ |
15 |
675 |
483 |
28 |
17.25 |
4.29 |
4/30 |
|
24.79 |
Ishant Sharma |
Ind |
7 |
321 |
310 |
13 |
23.85 |
5.79 |
3/33 |
Worst bowling strike-rates: (min 300 balls)
|
S/R |
Bowler |
For |
M |
Balls |
Runs |
Wkts |
Ave. |
R/O |
Best |
|
91.50 |
James Franklin |
NZ |
10 |
366 |
294 |
4 |
73.50 |
4.82 |
2/40 |
|
90.75 |
Chris Harris |
NZ |
9 |
363 |
281 |
4 |
70.25 |
4.64 |
1/29 |
|
87.00 |
Mashrafe Mortaza |
Ban |
7 |
348 |
261 |
4 |
65.25 |
4.50 |
1/16 |
|
85.50 |
Corey Collymore |
WI |
7 |
342 |
234 |
4 |
58.50 |
4.11 |
2/24 |
|
83.00 |
Upul Chandana |
SL |
8 |
332 |
265 |
4 |
66.25 |
4.79 |
2/39 |
|
66.20 |
Mohd Hafeez |
Pak |
11 |
331 |
228 |
5 |
45.60 |
4.13 |
1/14 |
|
66.00 |
Mohd Rafique |
Ban |
8 |
396 |
291 |
6 |
48.50 |
4.41 |
2/26 |
Leading wicket-takers:
|
Wkts |
Bowler |
For |
M |
Balls |
Runs |
Ave. |
S/R |
R/O |
Best |
|
28 |
Kyle Mills |
NZ |
15 |
675 |
483 |
17.25 |
24.11 |
4.29 |
4/30 |
|
25 |
Lasith Malinga |
SL |
16 |
864 |
766 |
30.64 |
34.56 |
5.32 |
4/34 |
|
24 |
M Muralitharan |
SL |
17 |
805 |
484 |
20.17 |
33.54 |
3.61 |
4/15 |
|
22 |
Brett Lee |
Aus |
16 |
739 |
591 |
26.86 |
33.59 |
4.80 |
3/38 |
|
21 |
Glenn McGrath |
Aus |
12 |
612 |
412 |
19.62 |
29.14 |
4.04 |
5/37 |
|
21 |
James Anderson |
Eng |
12 |
608 |
457 |
21.76 |
28.95 |
4.51 |
3/20 |
|
20 |
Jacques Kallis |
SA |
17 |
639 |
525 |
26.25 |
31.95 |
4.93 |
5/30 |
Hat-tricks (1)
|
Bowler |
Bowl |
For |
Opp |
Venue |
Date |
Result |
|
Jermome Taylor |
4/49 |
WI |
Aus |
MumbaiBS |
18-10-2006 |
Won |
Best all-round performance in a match (50 runs and three-wicket haul)
|
Player |
For |
Runs |
Wkts |
Opp |
Venue |
Date |
Result |
|
Sachin Tendulkar |
Ind |
141 |
4/38 |
Australia |
Dhaka |
28-10-1998 |
Won |
|
Chris Gayle |
WI |
101 |
3/31 |
England |
Ahmedabad |
28-10-2006 |
Lost |
|
Ryan McLaren |
SA |
71* |
3/70 |
India |
Cardiff |
06-06-2013 |
Lost |
|
Virender Sehwag |
Ind |
59 |
3/25 |
South Africa |
Colombo RPS |
25-09-2002 |
Won |
|
Elton Chigumbura |
Zim |
57 |
3/37 |
Sri Lanka |
The Oval |
14-09-2004 |
Lost |
|
Shahid Afridi |
Pak |
55* |
3/18 |
Netherlands |
Colombo SSC |
21-09-2002 |
Won |
Best all-round performance in the tournament (250 runs & 15 wickets)
|
Player |
For |
M |
Runs |
Ave. |
Wkts |
Ave. |
|
Jacques Kallis |
SAf |
17 |
653 |
46.64 |
20 |
26.25 |
|
Chris Gayle |
WI |
17 |
791 |
52.73 |
17 |
22.35 |
|
Shane Watson |
Aus |
17 |
453 |
41.18 |
17 |
23.29 |
|
Daniel Vettori |
NZ |
17 |
299 |
37.38 |
18 |
29.00 |
Note:Kallis (above) is the only player with 500 runs and 20 wickets in the tournament
Most catches by a fielder
|
Cts |
M |
Fielder |
For |
|
15 |
22 |
Mahela Jayawardene |
SL |
|
12 |
11 |
Ross Taylor |
NZ |
|
12 |
13 |
Sourav Ganguly |
Ind |
|
12 |
15 |
Dwayne Bravo |
WI |
Most dismissals by a wicket-keeper
|
Dism |
Cts |
Sts |
M |
Wicket-keeper |
For |
|
33 |
28 |
5 |
20 |
Kumar Sangakkara |
SL |
|
25 |
23 |
2 |
13 |
Adam Gilchrist |
Aus |
|
19 |
15 |
4 |
16 |
M. S. Dhoni |
Ind |
|
19 |
17 |
2 |
17 |
Mark Boucher |
SA |
|
15 |
14 |
1 |
11 |
Brendon McCullum |
NZ |
Most matches
|
M |
Player |
For |
From |
To |
|
22 |
Mahela Jayawardene |
SL |
2000 |
2013 |
|
22 |
Kumar Sangakkara |
SL |
2000 |
2013 |
|
20 |
Sanath Jayasuriya |
SL |
1998 |
2009 |
|
20 |
Shoaib Malik |
Pak |
2002 |
2017 |
|
19 |
Rahul Dravid |
Ind |
1998 |
2009 |
|
18 |
Brian Lara |
WI |
1998 |
2006 |
|
18 |
Ricky Ponting |
Aus |
1998 |
2009 |
|
18 |
Yuvraj Singh |
Ind |
2000 |
2017 |